Introduction:
This case study explores the development of an Energy Consumption dashboard for an Energy Management company that installed solar panels to reduce electricity usage from the grid. The company sought to analyze the impact of the solar panel installation on overall energy consumption through comprehensive data visualization.

Problem Statement :

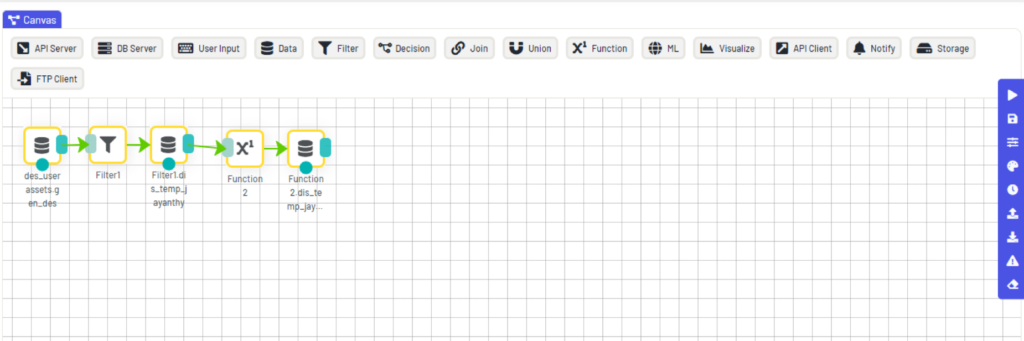
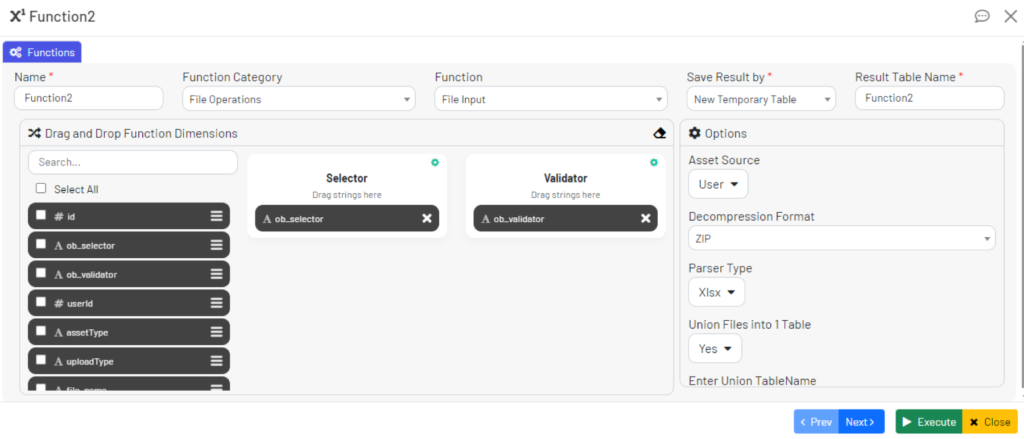
The Energy Management company faced challenges in analyzing daily power and load data from both grid power mode and battery mode. The data, spanning over six months, was stored in hundreds of individual Excel files, making it cumbersome and time-consuming to ingest and analyze. The company required a solution to efficiently aggregate and analyze this historical data to understand the impact of solar panel installation on energy consumption.


Challenges:

  • Data Fragmentation:
    Daily power and load data stored in hundreds of individual Excel files made it challenging to aggregate and analyze the data effectively.
  • Data Ingestion:
    Manually ingesting data from multiple Excel files into a single platform for analysis was time-consuming and prone to errors.
  • Data Analysis: Conducting energy analytics on historical data to derive insights and trends required sophisticated tools and expertise.
  • Dashboard Creation: Developing intuitive dashboards to visualize energy consumption trends and the impact of solar panel installation required significant time and effort.


Solution:

  • Data Aggregation:
    The Energy Management company utilized the PIRL platform to aggregate 150+ individual Excel files into a single zip file for efficient data handling.
  • Data Ingestion:
    The zip file was uploaded via PIRL’s File Browser module, and the File Input Function was configured to process each file within the zip, dynamically identifying data types and allowing user modifications if necessary.
  • Data Analysis:
    Once uploaded to PIRL, energy analytics were performed on the aggregated data, leveraging the platform’s built-in analytics capabilities.
  • Dashboard Creation:
    Dashboards were created within PIRL to visualize energy consumption trends, comparing data from grid power mode and battery mode, and analyzing the impact of solar panel installation on overall energy consumption.

Results

  • Efficient Data Handling:
    Aggregating individual Excel files into a single zip file streamlined data handling and ingestion processes, reducing manual effort and potential errors.
  • Accurate Data Analysis:
    Leveraging PIRL’s analytics capabilities, the Energy Management company performed comprehensive energy analytics on historical data, deriving valuable insights into energy consumption patterns and trends.
  • Insightful Dashboards:
    The creation of intuitive dashboards within PIRL enabled stakeholders to visualize energy consumption trends easily, facilitating data-driven decision-making.
  • Enhanced Efficiency:
    By leveraging PIRL’s integrated workflow and analytics features, the Energy Management company achieved efficient data analysis and dashboard creation, saving time and resources.


Benefits 

  • Improved Decision-Making:
    Access to insightful dashboards allowed stakeholders to make informed decisions regarding energy management strategies and investments.
  • Cost Savings:
    Streamlining data handling and analysis processes with PIRL resulted in cost savings associated with reduced manual effort and increased efficiency.
  • Enhanced Visibility:
    Comprehensive energy analytics and intuitive dashboards provided stakeholders with enhanced visibility into energy consumption patterns, enabling proactive measures to optimize energy usage.
  • Sustainable Operations:
    By analyzing the impact of solar panel installation on energy consumption, the Energy Management company could promote sustainable energy practices and reduce reliance on grid power.


Let’s Connect

Please send me more details about Energy Consumption Dashboard for an Energy Management company